From Wikipedia, the free encyclopedia
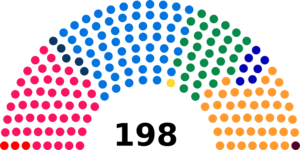
Federal elections were held in Switzerland on 25 October 1925.[1] The Free Democratic Party remained the largest party in the National Council, winning 60 of the 198 seats.[2]
Results[edit]
National Council[edit]
 |
|---|
| Party | Votes | % | Seats | +/– |
|---|
| Free Democratic Party | 206,485 | 27.77 | 60 | 0 |
| Social Democratic Party | 192,208 | 25.85 | 49 | +6 |
| Conservative People's Party | 155,467 | 20.91 | 42 | –2 |
| Party of Farmers, Traders and Independents | 113,512 | 15.26 | 30 | –4 |
| Liberal Democratic Party | 22,217 | 2.99 | 7 | –3 |
| Democratic Group | 16,362 | 2.20 | 5 | +2 |
| Communist Party | 14,837 | 2.00 | 3 | +1 |
| Evangelical People's Party | 6,888 | 0.93 | 1 | 0 |
| Liberal Socialist Party | 1,602 | 0.22 | 0 | 0 |
| Grütli Union | 427 | 0.06 | 0 | 0 |
| Union for Economic Defence | 13,674 | 1.84 | 1 | New |
| Other parties | 0 | – |
| Total | 743,679 | 100.00 | 198 | 0 |
|
| Valid votes | 743,679 | 97.26 | |
|---|
| Invalid/blank votes | 20,915 | 2.74 | |
|---|
| Total votes | 764,594 | 100.00 | |
|---|
| Registered voters/turnout | 995,551 | 76.80 | |
|---|
| Source: Nohlen & Stöver |
By constituencies[edit]
Council of States[edit]
In several cantons the members of the Council of States were chosen by the cantonal parliaments.[3]
By canton[edit]
References[edit]


.svg)

