Concordia, Antioquia
Concordia, Antioquia | |
|---|---|
Municipality and town | |
 | |
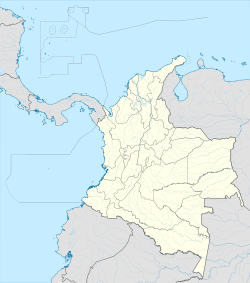
 Location of the municipality and town of Concordia, Antioquia in the Antioquia Department of Colombia | |
| Coordinates: 6°2′56.4″N 75°54′32.4″W / 6.049000°N 75.909000°W | |
| Country | |
| Department | |
| Subregion | Southwestern |
| Population (Census 2018[1]) | |
| • Total | 16,095 |
| Time zone | UTC-5 (Colombia Standard Time) |
Concordia (Spanish pronunciation: [koŋˈkoɾðja]) is a town and municipality in the Colombian department of Antioquia. It is part of the sub-region of Southwestern Antioquia.
This municipality is located at 2,000 meters above sea level At 6° 2'59.82"N 75°55'11.88"W. Has a population of 25,000 including the surrounding areas. The inhabitants of this mountains survives mainly from the coffee trade.
It was founded in 1830 by Juan José Restrepo Uribe, and originally named as Selva Virgen (Virgin Jungle), it was later renamed La Comia.
Climate[edit]
| Climate data for Concordia, elevation 1,904 m (6,247 ft), (1981–2010) | |||||||||||||
|---|---|---|---|---|---|---|---|---|---|---|---|---|---|
| Month | Jan | Feb | Mar | Apr | May | Jun | Jul | Aug | Sep | Oct | Nov | Dec | Year |
| Mean daily maximum °C (°F) | 23.4 (74.1) |
23.9 (75.0) |
23.6 (74.5) |
23.2 (73.8) |
23.0 (73.4) |
23.4 (74.1) |
23.7 (74.7) |
23.9 (75.0) |
23.2 (73.8) |
22.5 (72.5) |
22.4 (72.3) |
22.7 (72.9) |
23.2 (73.8) |
| Daily mean °C (°F) | 18.5 (65.3) |
18.8 (65.8) |
18.8 (65.8) |
18.6 (65.5) |
18.6 (65.5) |
18.8 (65.8) |
18.9 (66.0) |
18.8 (65.8) |
18.4 (65.1) |
17.9 (64.2) |
17.8 (64.0) |
18.1 (64.6) |
18.5 (65.3) |
| Mean daily minimum °C (°F) | 14.3 (57.7) |
14.4 (57.9) |
14.4 (57.9) |
14.4 (57.9) |
14.5 (58.1) |
14.5 (58.1) |
14.4 (57.9) |
14.3 (57.7) |
14.0 (57.2) |
14.0 (57.2) |
14.0 (57.2) |
14.2 (57.6) |
14.3 (57.7) |
| Average precipitation mm (inches) | 90.4 (3.56) |
109.7 (4.32) |
154.4 (6.08) |
252.8 (9.95) |
277.6 (10.93) |
233.4 (9.19) |
196.4 (7.73) |
198.2 (7.80) |
253.7 (9.99) |
294.7 (11.60) |
237.6 (9.35) |
152.9 (6.02) |
2,451.7 (96.52) |
| Average precipitation days (≥ 1.0 mm) | 11 | 13 | 16 | 21 | 22 | 19 | 18 | 18 | 21 | 23 | 21 | 15 | 215 |
| Average relative humidity (%) | 81 | 80 | 80 | 82 | 83 | 82 | 79 | 79 | 82 | 83 | 85 | 84 | 82 |
| Mean monthly sunshine hours | 158.1 | 146.8 | 139.5 | 111.0 | 127.1 | 162.0 | 189.1 | 170.5 | 144.0 | 114.7 | 108.0 | 127.1 | 1,697.9 |
| Mean daily sunshine hours | 5.1 | 5.2 | 4.5 | 3.7 | 4.1 | 5.4 | 6.1 | 5.5 | 4.8 | 3.7 | 3.6 | 4.1 | 4.7 |
| Source: Instituto de Hidrologia Meteorologia y Estudios Ambientales[2] | |||||||||||||
References[edit]
- (in Spanish) Concordia official website
- ^ "Censo Nacional de Población y Vivienda 2018" (in Spanish). DANE. Retrieved 23 April 2020.
- ^ "Promedios Climatológicos 1981–2010" (in Spanish). Instituto de Hidrologia Meteorologia y Estudios Ambientales. Archived from the original on 15 August 2016. Retrieved 3 June 2024.


